How to Feed Log Data From Vms to Oms in Azure
Using Azure Log Analytics Workspaces to collect Custom Logs from your VM
and no, we are not talking about the Azure Monitor with predefined metrics.

Motivation:
We all have seen the Monitoring Tab Key Metrics on the VM Page. Yes, it is useful to see whether the CPU has been running or not through the CPU metrics, to check when the VM is getting the data from the outside world through Network In metrics and if the VM is doing any kind of write operation using Disk Operations/Sec metrics but it's not effective for the custom services that we build on VM. So, in this blog, I will be giving you an example of how to create your own log based on customer service, bring it to Azure Log Analytics Workspace using its default agent, and query it according to our needs, even better create an alert on it.
Prerequisites:
- An Azure Account
- Azure Virtual Machine Service
- Azure Log Analytics Workspace Service
- Azure Alert Service
Azure Virtual Machine:
Let's start with the VM itself. You already have the service running on the VM but don't know how to get those logs into the portal or even create a log for your services. So, let's assume that you have not created the logs for your services. So for this blog, I will be taking a simple flask app as my example for the service. To get it up and running we must download the flask library from pip and then create a flask app similar to this below:
Nothing much, just a simple flask app running on default port 5000. Let's run it by this command below:
python app.py The service must be running. Now that's done let's move to the log part. The trick that we are going to use all depends on the grep. As the grep command will help us find the running service, we will leverage it to know whether the app service is working or not. So, I create this bash script to know if the app service is running or not. If it is running I would give it a 200 success code and if it's not then 500 error code shall it get.
Pretty neat and easy until here. Now try to run the script and it will show 200 or 500 according to your service status. But we cannot do this manually forever. So for the automation, I used crontab to run the script for me every minute. Open your crontab by 'crontab -e' and then enter this command
To explain it, the first part deals with where your bash script lies and the second part deals with where you want to place the generated log files. I suggest you create the file and folder and give appropriate permissions 'chmod' before placing it in on the crontab. Now let's wait for 5 minutes and check whether the logs are written or not.

Seems like it's working as expected as I had closed my service before running it on the crontab. Copy 5 of those messages and save them on a new file and we will need to submit a sample of it to the Log Analytics Workspace. Now, let's move onto the Azure portal.
Azure Log Analytics Workspace:
Go to your VM and then select 'Logs' and click on the 'Enable' button. You will be prompted to create a new workspace.

The workspace takes 5–10 minutes so be patient. After the workspace has been created go to the Insights tab
What we are doing right now is installing the Azure Log Analytics Workspace with some click of our button. We can also create using the CLI but I would prefer the portal way. If and only if the portal doesn't work then I would go for the CLI way. Now let's configure our machine to take the custom logs. Go to the Logs Analytics Workspace that you created and click on 'Advanced Settings' which will prompt you to a new page.

Click on 'Data' and 'Custom Logs'. There you will see an 'Add +' button. Click on it and you will be prompted with a new tab.
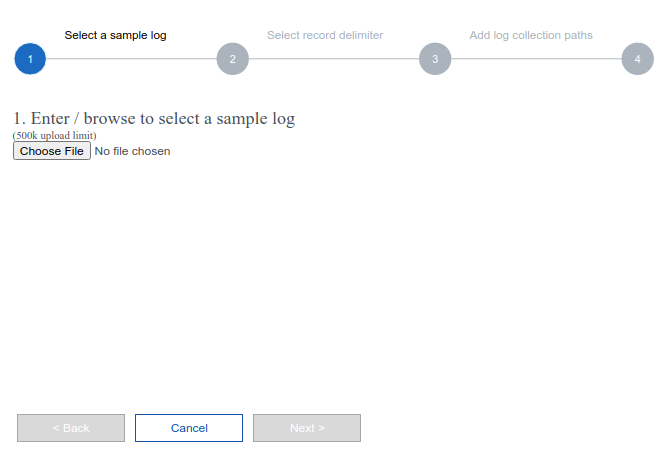
Upload that sample log that you saved above and click 'Next'. you will see the option for 'new line' and 'timestamp'. Select 'new line' and click on 'Next'

Give the path that you have on the crontab and hit 'Next'

Give appropriate Name as we will be using this name for our query if needed.

Don't forget to select the 'Apply below configuration to my Linux machines'. Now let's see whether the logs arrived or not. Azure documentation says that it may take 1 hour for the logs to arrive but in my case, it arrived in like 20 minutes. So please follow the steps well and wait for the logs to arrive. Now, click on the 'Logs' and you will be prompted with a window to enter some SQL-like commands. It's actually Kusto Query Language which is similar to SQL so we can use it using the references that Azure has provided. I will also link the guide in the Resources section below.

As you can see that it worked. Congratulation if you have made it this far cause you have done a pretty good job bringing your custom logs into the Azure Portal. Now you can play with it, query it, analyze it, and much more. In this next section, I am going to create an alert based on the custom logs.
Azure Alerts:
So far we brought the custom logs to the Azure portal, which is a pretty big job already, but still, we want to do more. So, let's create an alert based on the Custom Logs. As you have already realized that the custom logs are messy so what we are going to do is clean it first using Kusto Query Language (KQL).

What we have done here is just extracted the status code out of our custom logs. Pretty neat should I say. Now, what we are going to do is create an alert based on the status code. If the service doesn't run we will get a 500 error code, so we are going to create an alert if the service is not working using the 500 error code. Click on the 'New alert rule' which will prompt you to a new page.

Enter the selection that I have made. We are using the Aggregation type as Maximum because there is only two status code for us and the alert logic is descriptive itself. Click on Next and 'Create action group' to enter your phone number or your email.

After creating the Action group go back and you will see your newly created action group. Give your alert name and 'Review + Create'. Now let's wait for 5 minutes and see whether an email will pop up or not.
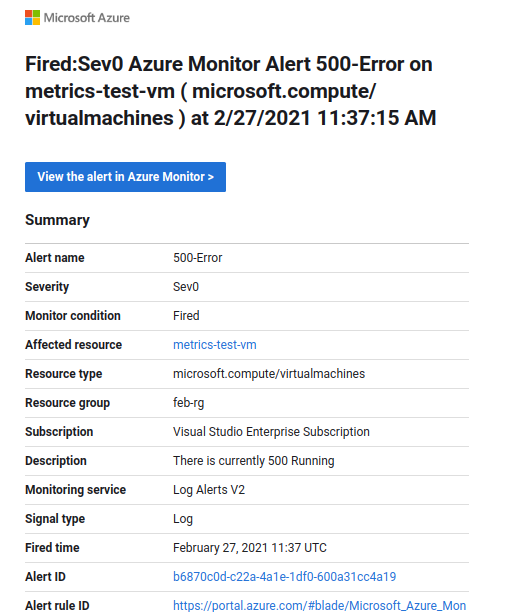
Yayy, the alert got triggered and we got an email. Congratulation if you have made it this far because this was not an easy task.
Conclusion:
We created a service, generated a log out of it every minute, brought it to the Azure portal, and created an alert based on it. This same logic can be applied for GPU metrics if you want to create a log of your GPU to know its status while training a model for a machine learning task. It can also be applied to different web services to know their status and much more. The possibilities are endless, the choices are endless and it's up to you for what you want to make it. If you encounter any problems or have difficulty following the steps, comment below on this post or message me at tsulabh4@gmail.com. You can also connect with me on Linkedin and GitHub.
Source: https://towardsdatascience.com/using-azure-log-analytics-workspaces-to-collect-custom-logs-from-your-vm-99ef7816a0fe
0 Response to "How to Feed Log Data From Vms to Oms in Azure"
Post a Comment